Statistical Formulas Series: Sample Standard Deviation-S #statistics #maths #sigma
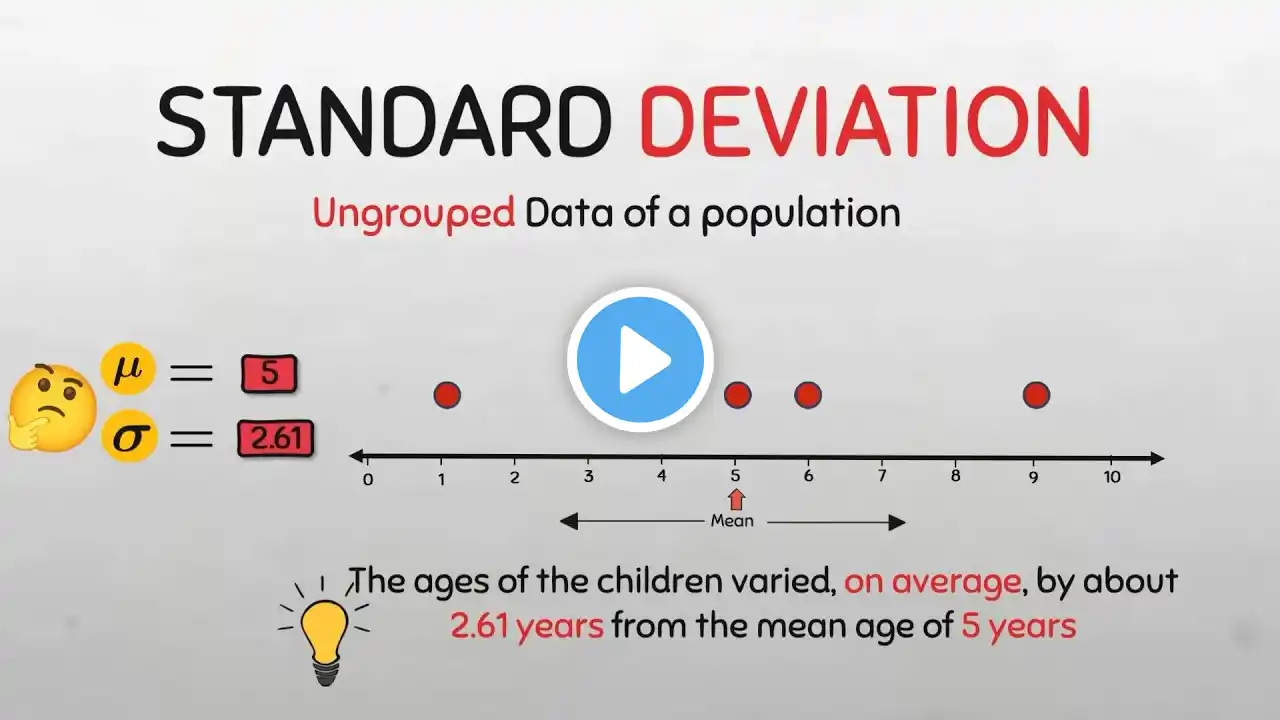
Population standard deviation (or σ) measures how dispersed the data is with the population's mean. A low or small standard deviation indicates data are clustered tightly around the mean, and a high or large standard deviation indicates data are more spread out. This is the formula for calculating the Standard Deviation of a population Related videos 1. Find the Mean, Median, and Mode for INDIVIDUAL series • Find the MEAN, MODE AND MEDIAN FOR IN... 2. Find the Mean, Median, and Mode for DISCRETE series 3. Find the Mean, Median, & Mode for CONTINUOUS series • Find the MEAN, MODE and MEDIAN for C... 4. Find the Mean Deviation of ALL series Data • Mean Absolute Deviation for Individua... 5. Find the range for All series data • Measures of Dispersion 1.1 : Range of... 6. Understanding statistical symbols: Sigma • Understanding Statistical Symbols: Si... Subscribe to My other channels: Stata: / @statadojo Biostatistics: / biostatisticsfortherestofus Public Health: / publichealthresources SPSS: / @spss4research EPI Info: / epiinfoforrookiese4r #sigma #statistics #maths #centraltendency #education #medians #mean #arithmetic ##probability #educationalstatistics #statistics #mathematics #standard #standarddeviation