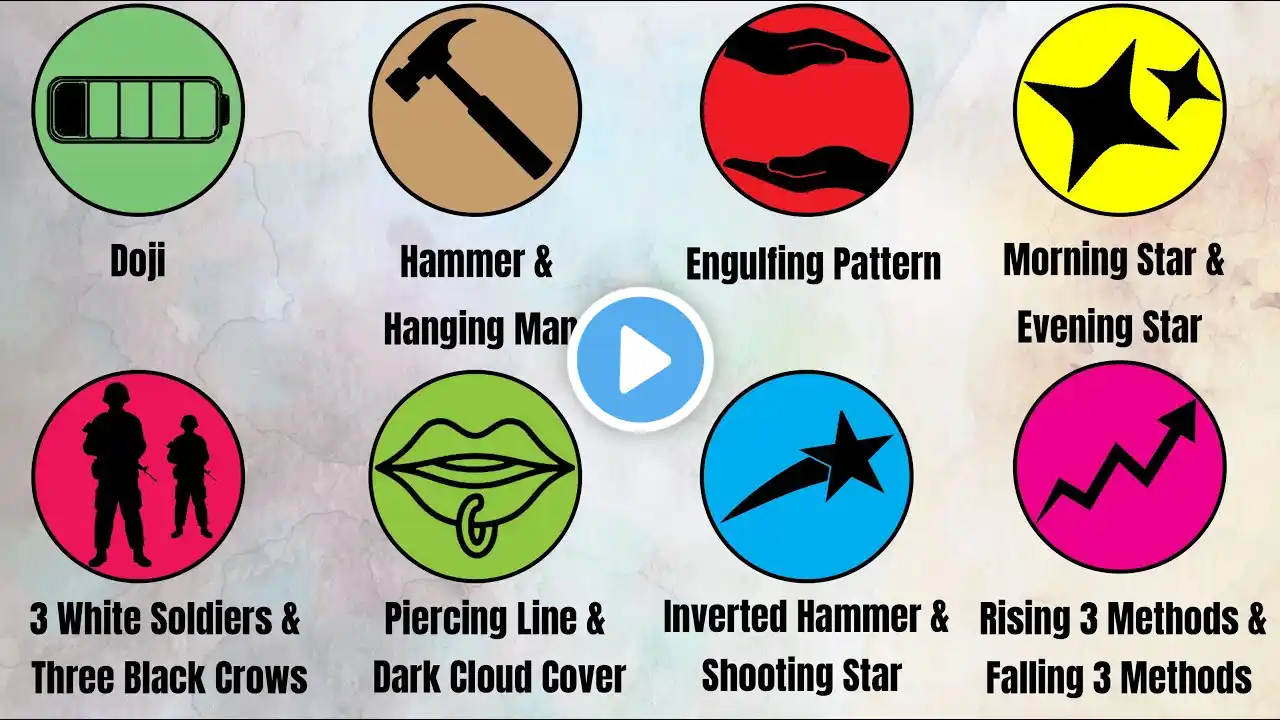
Candlestick Patterns for Trading: Quick Guide (Hammer, Hanging Man, Shooting Star, Morning Star)
This short and engaging video provides a rapid-fire introduction to four fundamental single and multi-candlestick patterns essential for technical analysis in trading. These patterns are powerful visual tools that signal potential market reversals, helping traders identify entry and exit points. Patterns Covered: 🔨 Hammer (Bullish Reversal): Indicates a potential BUY signal, typically appearing after a downtrend. Characterized by a small body and a long lower wick, showing that sellers drove the price down but buyers overcame the pressure to close near the open. 🧍 Hanging Man (Bearish Reversal): Indicates a potential SELL signal, typically appearing after an uptrend. Has the same shape as a Hammer (small body, long lower wick) but suggests that buying pressure is weakening as sellers are starting to appear. ⭐ Shooting Star (Bearish Reversal): Indicates a potential SELL signal, typically appearing after an uptrend. Characterized by a small body and a long upper wick, showing that buyers attempted to push the price up but sellers took control, driving the price back down. 🌅 Morning Star (Bullish Reversal): Indicates a potential BUY signal, typically appearing after a downtrend. A three-candlestick pattern that shows a transition from selling pressure (long red candle) to market indecision (small-bodied 'star' candle) and finally to strong buying pressure (long green candle). Disclaimer: This content is for educational purposes only and is not financial or investment advice. Trading involves risk.