Google Earth Data Plotting Tutorial in Urdu
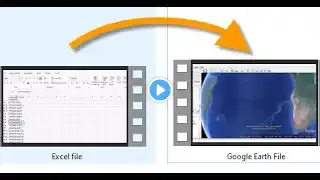
Learn how to plot data on Google Earth in this easy tutorial. Follow along step by step to create your own visualizations on Google Earth! Unlock the power of Google Earth and transform your data into compelling visual maps! In this easy-to-follow tutorial, we'll guide you through the process of plotting your data on Google Earth, even if you're a complete beginner. Learn how to import data from Excel and CSV files, create KML/KMZ files, and plot points, lines, and polygons with precision. Whether you're a researcher, student, business owner, or simply curious about geospatial data, this video will show you how to leverage Google Earth to gain valuable insights. We'll cover everything from basic interface navigation to advanced customization techniques, including changing colors, icons, and styles. What you'll learn: Understanding Google Earth's interface and tools. Importing data from Excel/CSV files. Plotting points Customizing map visuals for clear presentations. Don't miss out on this opportunity to enhance your data visualization skills! Watch now and start creating your own interactive maps with Google Earth. Google Earth, Data Plotting, Mapping, KML, KMZ, CSV, Excel, Geographic Data, Data Visualization, Map Tutorial, Geospatial Analysis, Location Data, Map Creation, Data Import, Google Earth Pro. #GoogleEarth #DataPlotting #MappingTutorial #KML #KMZ #DataVisualization #GeographicData #MapMaking #GeospatialAnalysis #ExcelToMap #CSVToMap #LocationData #MapTutorial #DataAnalysis #GIS #GoogleEarthPro #Tutorial #LearnMapping #MapSkills #DataScience #VisualData